Class Diagram provides an overview of the target system by describing the objects and classes inside the system and the relationships between them. It provides a wide variety of usages; from modeling the domain-specific data structure to detailed design of the target system. With the share model facilities, you can reuse your class model in the interaction diagram for modeling the detailed design of the dynamic behavior. The Form Diagram allows you to generate diagram automatically with user-defined scope.
Class diagram 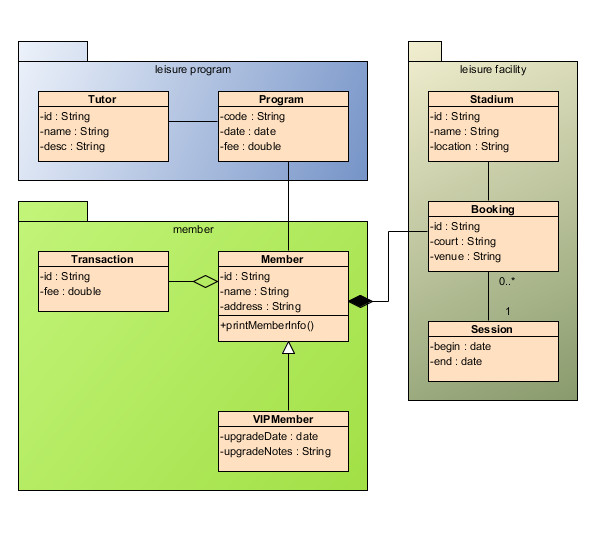 Use case diagram Creating Use Case Diagram for describing the behavior of the target system from an external point of view. Besides drawing the diagram, VP-UML allows you to detail document the requirements through the Use Case Description. All these information can be output into HTML//PDF//MS Word formats.
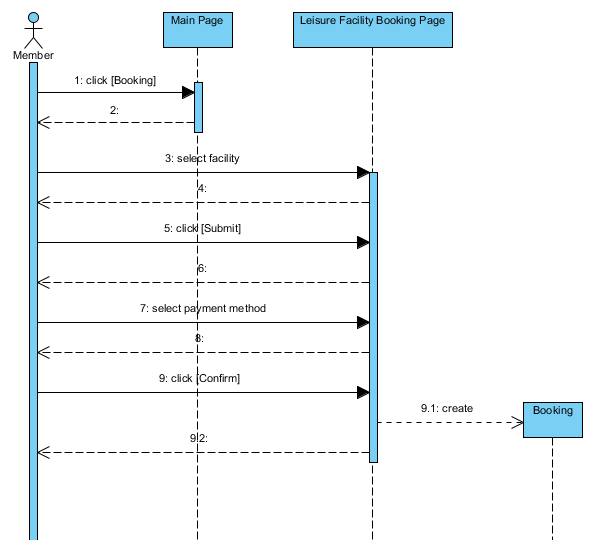
Use case diagram | 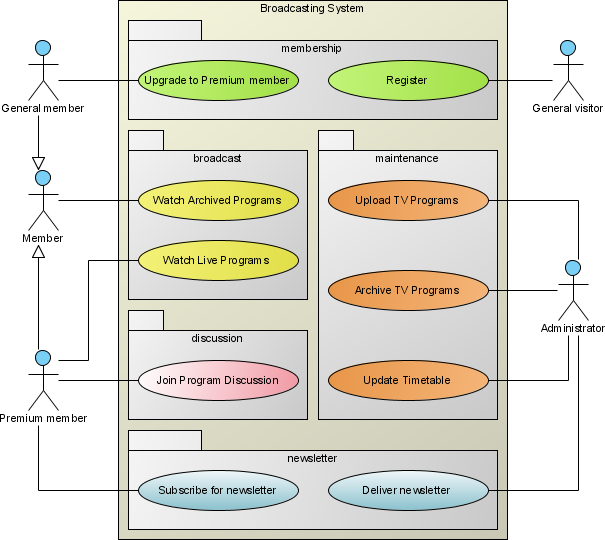 Sequence diagram | | The Sequence Diagram models the collaboration of objects based on a time sequence. It shows how the objects interact with others in a particular scenario of a use case. With the advanced visual modeling capability, you can create complex sequence diagram in few clicks. Besides, VP-UML can generate sequence diagram from the flow of events which you have defined in the use case description. | |
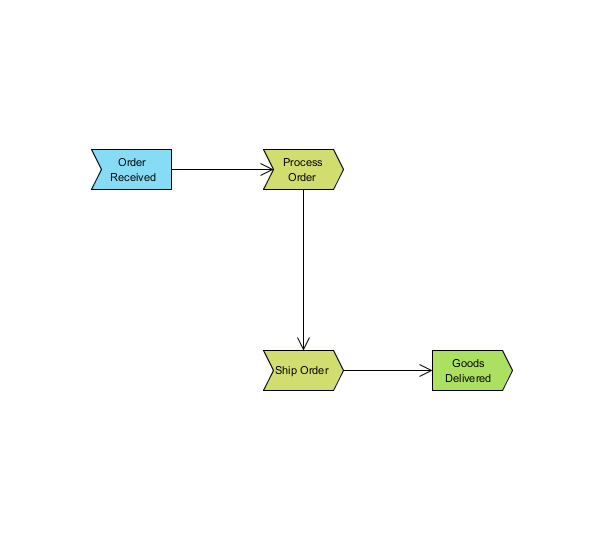
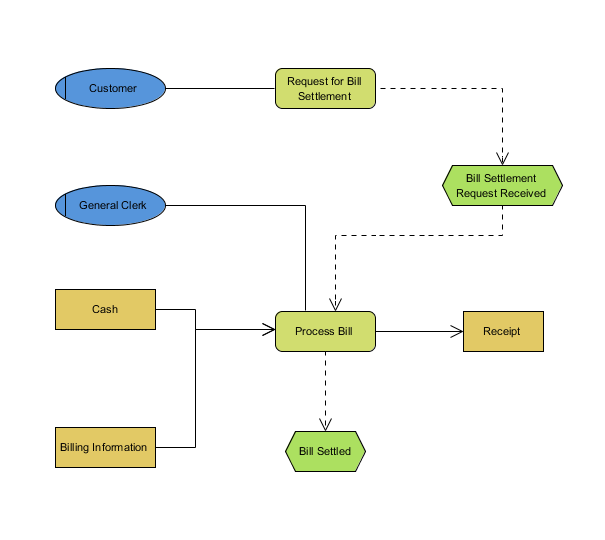
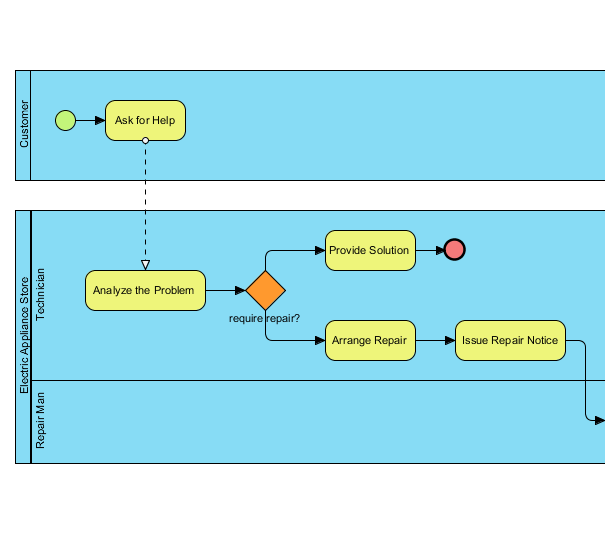
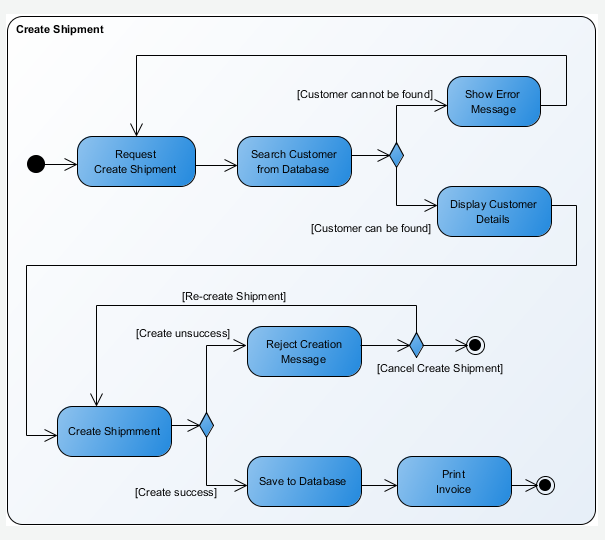
Activity diagram | | The Activity Diagram can help to describe the flow of control of the target system, such as the exploring complex business rules and operations, describing the use case also the business process. | |
|
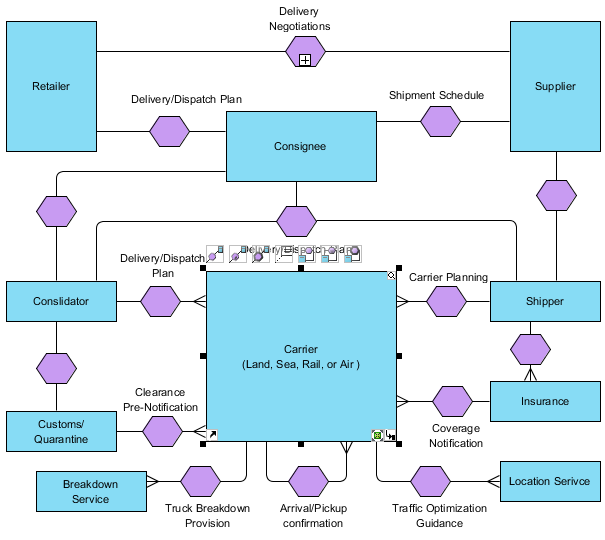
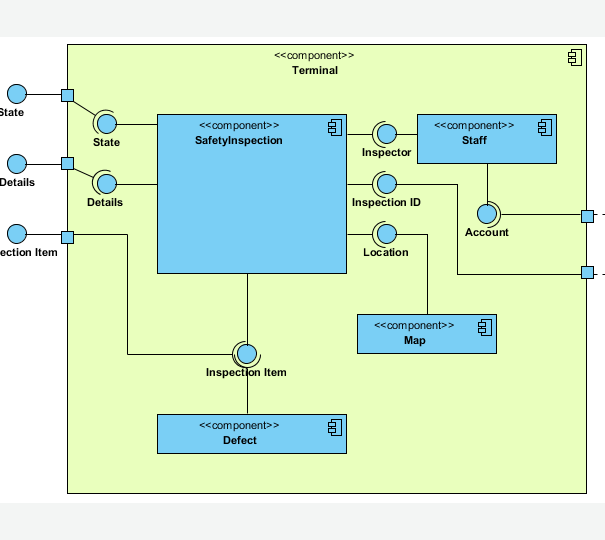
| Component diagram | The Component Diagram helps to model the physical aspect of an Object-Oriented software system. It illustrates the architectures of the software components and the dependencies between them. Those software components including run-time components, executable components also the source code components.
Component diagram
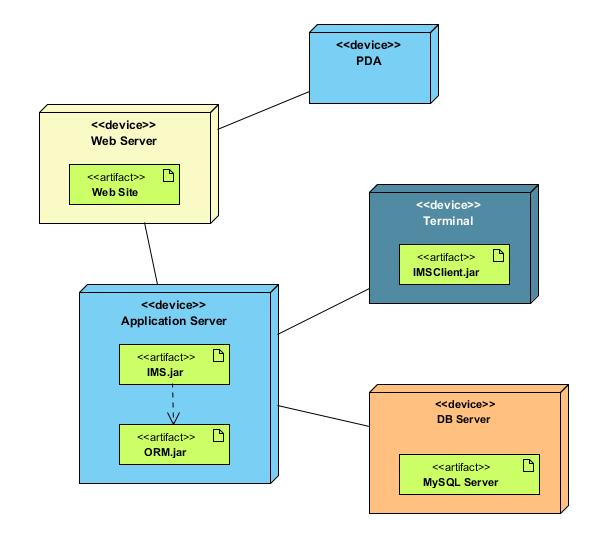
Deployment diagram | The Deployment Diagram also helps to model the physical aspect of an Object-Oriented software system. It models the run-time configuration in a static view and visualizes the distribution of components in an application. In most cases, it involves modeling the hardware configurations together with the software components that lived on.
Deployment diagram
|
|
| |
|
| |
State machine diagram | | The behavior of an entity is not only a direct consequence of its input, but it also depends on its preceding state. The history of an entity can best be modeled by a finite state diagram. State Machine diagram can show the different states of an entity also how an entity responds to various events by changing from one state to another. |
|
State machine diagram 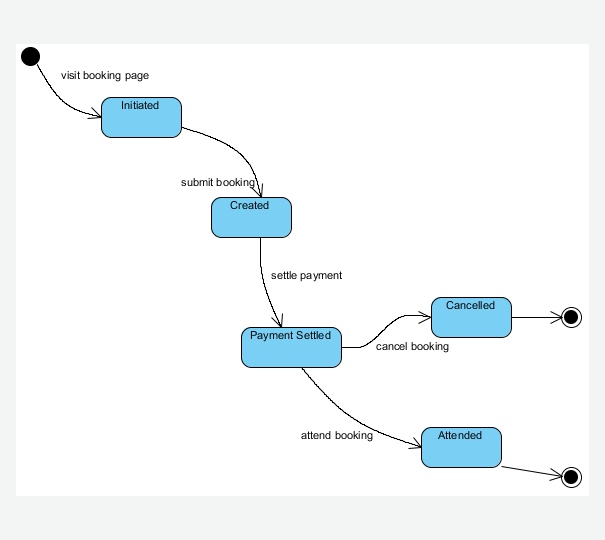 |
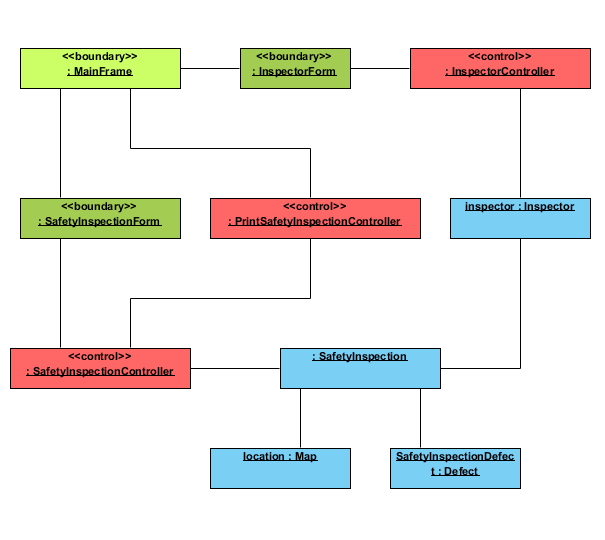
| Object diagram | | Object diagram shows a snapshot of instances of things in class diagrams. Similar to class diagrams, object diagrams show the static design of system but from the real or prototypical perspective. | |
Object diagram |